New in the energy dashboard: Hourly data on regional solar power production thanks to geodata and AI
 BFE - James Pocher
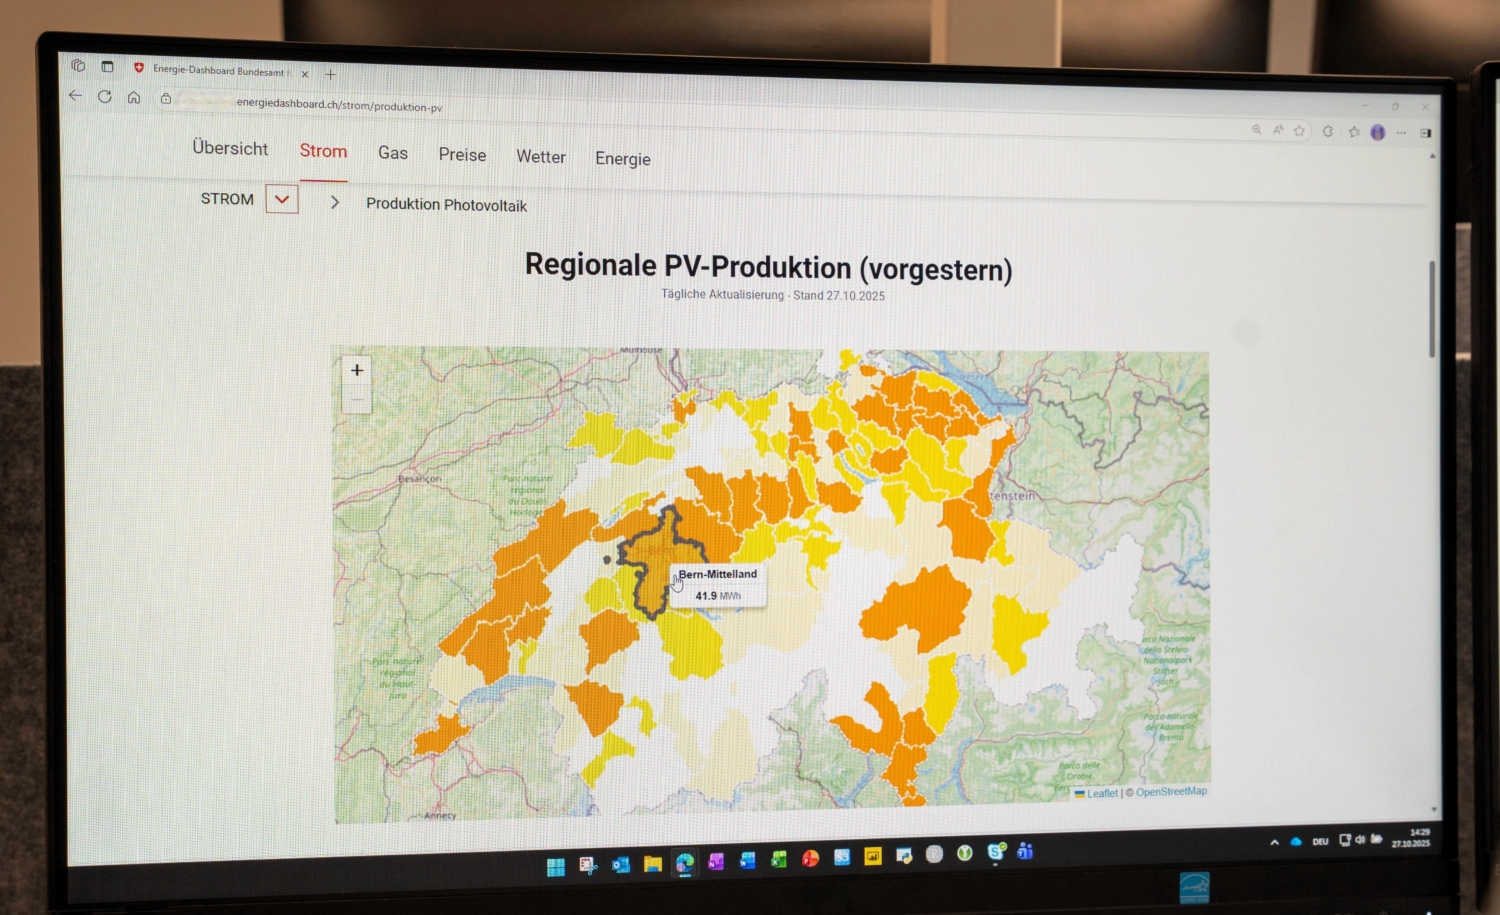
Where does the sun produce how much electricity? The energy dashboard of the Swiss Federal Office of Energy (SFOE) now shows the regional daily production in hourly resolution. The tool also provides a five-day forecast in hourly resolution.
The new data basis was developed by the SFOE together with the Swiss Data Science Center (SDSC) at ETH Zurich. Lucas Tochtermann from the SFOE, Christian Schneebeli and Roberto Castello from the SDSC explain why this innovation is relevant, who benefits from it and how reliable the estimates and forecasts are.
Energeiaplus: Why was this new function developed?
Lucas Tochtermann: Solar production is growing rapidly, but reliable, reliable and high-resolution data was previously lacking. The quality of available estimates has been rather unsatisfactory to date. Because solar power is dependent on the weather, it has a significant impact on the operation of the electricity grid. Inaccurate or missing forecasts, for example at weekends or on public holidays, can lead to higher costs for balancing energy, which end customers ultimately pay for via their electricity tariff. The new function in the energy dashboard now provides transparency and supports players such as grid operators with their forecasts as well as authorities and the public with up-to-date, regionally differentiated data.

Roberto Castello is Head Data Scientist at the Swiss Data Science Center (SDSC); Image: SDSC
Roberto Castello: "The Swiss Data Science Center has been working with the Swiss Federal Office of Energy for a long time to drive digital innovation in the energy sector. With this new function, we want to support even more stakeholders with sound data on the development of the Swiss energy transition.
The new information in the energy dashboard is particularly relevant for grid operators. In what way?
Lucas Tochtermann: For grid operators, up-to-date and reliable information on solar production is key to the stable operation of the electricity grid. If there is suddenly a lot of sunshine, the feed into the grid increases sharply. When it is cloudy, it drops again just as quickly. Such short-term fluctuations can only be balanced out if the grid operators know how much solar power is being produced in which region.
Some larger grid operators already have their own forecasting systems. Smaller grid operators, on the other hand, often do not have the resources or expertise to operate such models themselves and may buy them in at a high price. They therefore benefit in particular from the new data, because for the first time they have easy access to up-to-date and high-resolution information on PV production; we provide quarter-hourly values as open data.
Weather forecasts do not always match reality. Grid operators could rely on inaccurate or even incorrect data to control grid operation. How reliable are the five-day forecasts?

Lucas Tochtermann is Deputy Head of the Geoinformation & Digital Innovation Section at the Swiss Federal Office of Energy; Image: SFOE
Lucas Tochtermann: Every forecast is fraught with uncertainty, and the further it extends into the future, the greater this uncertainty becomes. This also applies to solar production, which is directly dependent on weather data. We use the best current models for this from MeteoSwiss and Copernicus and show the uncertainty transparently in the data. The five-day forecast shows the trend rather than exact values. As the calculations are updated daily with new weather data, the forecast quality is very high in the short term.
Christian Schneebeli: Forecasts for the next day and the day after are particularly important for grid operators. During this period, solar radiation forecasts are quite reliable. The models provide an additional basis for decision-making, but grid operators should definitely use their experience to classify the forecasts correctly.
Who else benefits from the new information in the energy dashboard?
Lucas Tochtermann: The data and the underlying methodology are published and are therefore available to all interested parties; in line with the principle of open source and open government data. In addition to grid operators, research and the energy sector also benefit: researchers can use the data for model comparisons and analyses, while energy companies can use it for new services or more precise forecasts. Increasing transparency also helps to strengthen public understanding of the transformation of the energy system.

Christian Schneebeli is Senior Data Scientist at the Swiss Data Science Center; Image: SDSC
Christian Schneebeli: The data can also support political discussions. If it becomes clear which regions have so far produced little solar power, this can help to ask the right questions locally and plan targeted incentives and support measures.
Where does the data for calculating production and the forecasts come from?
Christian Schneebeli: Several data sources come together for the calculation. First, we identify where PV systems are installed. We use the Pronovo register as a basis for this. However, it only shows the solar production that has been subsidized. We therefore supplement it with AI analyses of 10cm Swisstopo aerial images(aerial photographs) to identify missing or new installations. This is where geoinformation flows together with AI. Building information such as roof pitch and orientation comes from SwissBUILDINGS3D(swissBUILDINGS3D 2.0) and the building register(GWR | Swiss Federal Register of Buildings and Dwellings). We use data from Copernicus(Climate Data Store) for historical solar radiation and from MeteoSwiss(Open Data - MeteoSwiss) for the forecasts.
As not all regions are covered annually with aerial images, a growth factor is also calculated based on the new installation reports at Pronovo.
Where does artificial intelligence play a role in data collection?
Christian Schneebeli: Artificial intelligence is primarily used to identify solar installations. A pre-trained and fine-tuned deep neural network analyzes every pixel of the aerial images and decides whether it is a PV system. The model performance achieves an average error of around seven percent at district level. To calculate the final electricity production, we combine the estimated installed capacity with solar irradiation data and power and efficiency factors.
Lucas Tochtermann: Beyond the technical aspect, this project shows the potential of artificial intelligence, geoinformation and data science in the energy sector. They make it possible to gain new insights from existing public data from limited sources, create transparency and support data-based decisions.
What are the next steps in the development of PV data in the energy dashboard?
Lucas Tochtermann: We worked almost exclusively with publicly available data to develop the model. Only in isolated cases was it possible to use anonymized data from an energy supplier for validation. The model could be further improved with additional production data from different regions. However, the industry's willingness to cooperate is crucial for this.
Roberto Castello: In future, we would like to incorporate additional sources of information. For example, the data on production potential from sonnendach.ch will be incorporated into the model. We are also planning to calculate efficiency and performance factors for specific systems and regions. This will allow us to further refine the estimates and make the assessment of Swiss solar power production even more realistic.
Interview: Brigitte Mader, Swiss Federal Office of Energy, Communications
Picture: SFOE
 Noch keine Bewertungen


Neuste Kommentare