New Electricity Market Overview: How Electricity and Money Flow Through the Swiss Electricity System
 BFE
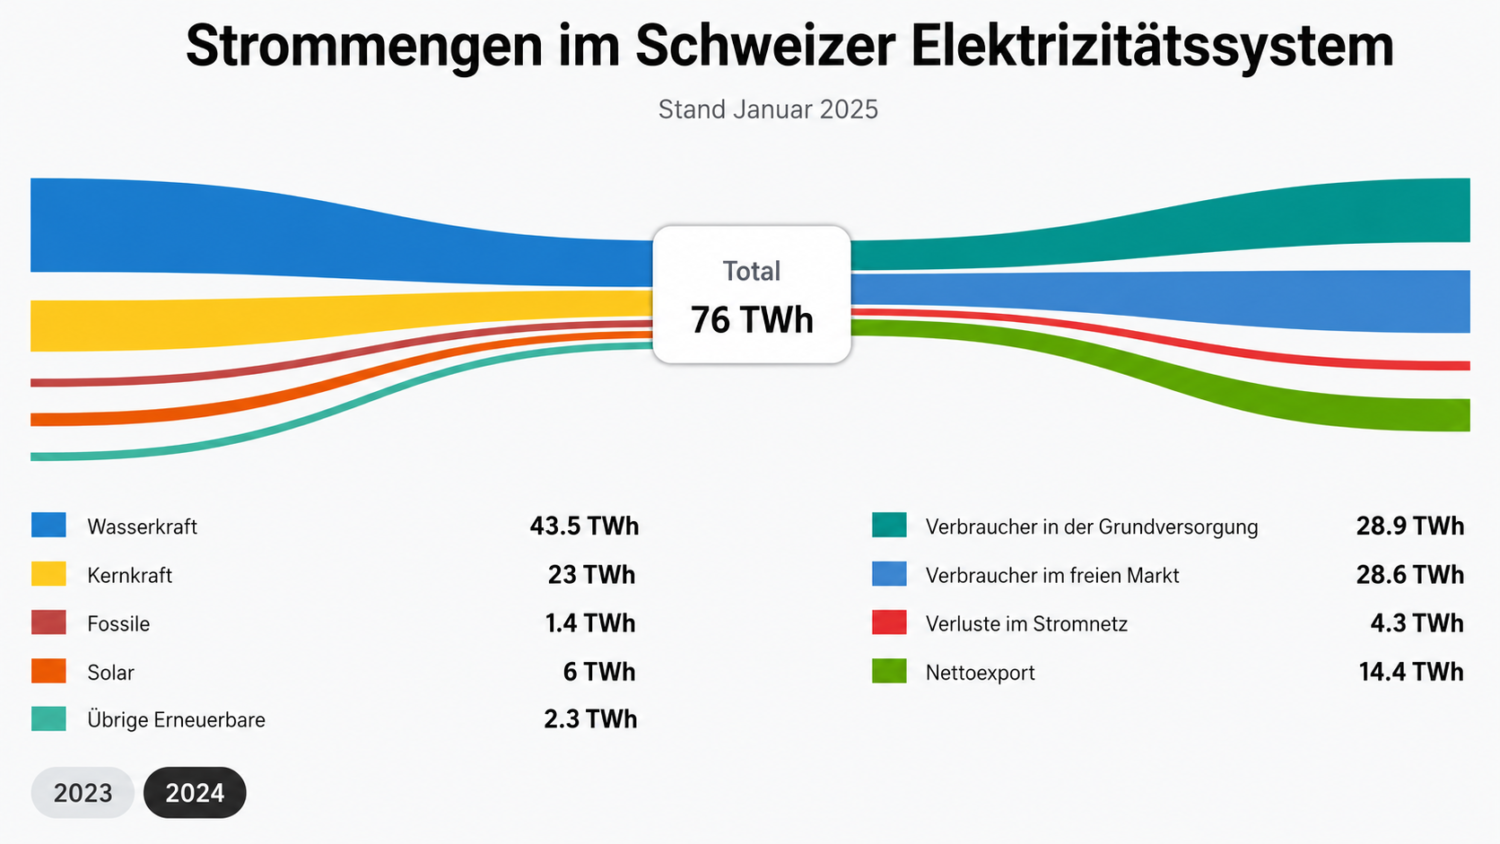
BFEWhere does Switzerland’s electricity come from, how does it reach consumers, and what financial flows are involved? A new visualization in the Federal Office of Energy’s (FOE) Energy Dashboard brings together the most important information about the Swiss electricity system in an interactive overview.
The Swiss electricity system consists of numerous interconnected actors and processes: power plants generate electricity, energy suppliers procure additional quantities on the market, grids transport and distribute the electricity, and consumers pay for energy, grid usage, and levies. Until now, this information has been scattered across various statistics, annual reports, and publications.
The SFOE has been compiling this synoptic overview of the Swiss electricity system for several years as a technical reference. It is now being made publicly available for the first time in a simplified and interactive format on the Energy Dashboard. “Synoptic” means that different perspectives are presented simultaneously and related to one another. This provides an overall picture of the electricity volumes, financial volumes, market structures, and costs of the Swiss electricity system.
From Power Plants to Consumers
The electricity overview first shows where the electricity available in Switzerland comes from. This includes domestic production from hydropower, nuclear energy, and new renewable energy sources, as well as electricity imports. On the other hand, it shows where the electricity flows: to consumers receiving basic service, to customers in the open market, for export, or as grid losses. The visualization depicts volume flows over the course of a year. It does not show a chronological sequence, nor does it indicate which electricity from a specific power plant flows to a specific consumer group. Rather, it compares the aggregated electricity volumes of the entire system.
The financial relationships also become apparent
The electricity system consists of more than just physical electricity flows. Costs and revenues also arise along the entire value chain. The new overview therefore shows which revenues are generated by consumers and how these are distributed across various tariff components. These include, in particular, the costs of energy, the use of the power grids, as well as levies and other legally mandated components.
Comparing the universal service and the free market
Another section of the overview focuses on the procurement and distribution of electricity. It shows what proportion of the supplied electricity comes from the utilities’ own generation and what proportion is procured on the market.
The cost structures of the basic service and the free market are also compared.
In addition, the overview shows the trend in revenue generated by consumers in the universal service sector and the free market. This allows for a better understanding of developments and differences between the two market segments.
Complex Interrelationships at a Glance
The key added value of the new electricity overview lies in linking information that was previously often considered in isolation. Users can not only access individual key figures but also understand their role within the overall system.
The presentation thus provides guidance for policymakers, government agencies, the energy sector, academia, the media, and the interested public. For example, it helps answer the following questions:
What is the share of the various generation technologies? What volumes of electricity are imported or exported? How are electricity volumes distributed between the basic supply and the free market? What costs are incurred in the grids? And how do the amounts paid by consumers relate to the costs along the value chain?
This overview is not intended to replace detailed technical statistics. Rather, it offers an accessible introduction and illustrates the most important relationships in a single presentation.
Transparent Foundations and Documented Assumptions
The Electricity Overview is based on aggregated annual data from various publicly available sources. These include, among others, statistics and reports from the SFOE, the Swiss Federal Electricity Commission (ElCom), Swissgrid, and Pronovo, as well as additional data on generation facilities and electricity markets.
The overview was developed by the SFOE in collaboration with E-CUBE Strategy Consultants. Where no directly available aggregate figures are available, values are derived based on documented assumptions and calculations.
Since only aggregated values are presented, no conclusions regarding individual companies, contracts, rates, or customers can be drawn from the overview.
To view the new electricity market overview on the Energy Dashboard:Temporary link (will change once live)
Lucas Tochtermann,

 5 Vote(s), Durchschnitt: 4,80
 Loading...





Neuste Kommentare